
Like709 appears to have a residual knee at about 90% such that peak white (vertical = 1) is reached at about 1.3 times nominal 100% exposure (horizontal=1). CineLike-D clips at about 430% exposure, HLG doesn’t clip until exposure reaches at least 700%, and V-LogL
never goes above 80% which it reaches at about 650% exposure.
https://tech.ebu.ch/docs/tech/tech3335_s29.pdf
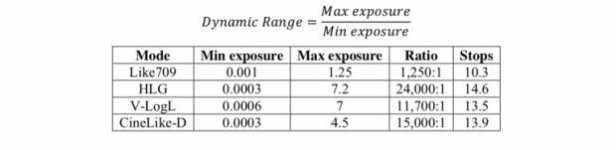
I'm calling foul on this rigged artifice of "nominal 100% exposure". It is a completely aribitrary, optically meaningless reference point that produces inflated marketing claims like "V-logL reaches 650% exposure", when in reality it clips at 80% of the 10-bit encoding range. The chart in figure 2 of the report, plotting linear light intensity vertically, versus so-called "nominal exposure" percentage on the X-axis, creates a totally misleading skewed portrayal of the measured data, making it appear that kneeless Like-709 has only "25% headroom" compared to 300-600% headroom with the other curves. That is the methodological fakery that produces Roberts' bogus Dynamic Range chart, listing "max exposure" as 1.25 for Like-709 versus 7 for HLG and V-logL. Those numbers are fabrications gerrymandered via artificial scaling of the gamma curves to coincide at an aribitrary reference point of 40% on the Rec 709 curve.
A more scientifically valid display of these gamma curves is shown in figure 3, where they are plotted on a logarithmic scale which matches the way our eyes actually respond to light. In this chart, all curves except V-logL* look practically identical until they reach the top end, where Like-709 appears to max out well before HLG and Cine-D. This is yet another way of skewing the data - in reality all curves max out at THE SAME POINT, where sensor saturation reaches 100%. THAT is the native reference point for measuring dynamic range, not "nominal 100% exposure" or "18% gray" or any other arbitrary point on these manufactured gamma curves.
Contrary to Roberts' systematic hedging of the data, Dynamic Range is not "a little speculative and subjective". It is a straighforward quotient of light intensity at 100% sensor saturation, divided by the level where detected light intensity is equal to the noise floor. It's not a chart of subjective interpretations, it should be a single, unambiguous number.
* Roberts finds the logarithmic V-logL curve "surprising", but it's no mystery, it's due to the master pedestal, a simple offset which he failed to properly compensate for in scaling the curve's dynamic range.
Last edited:


