^ I don't agree that film is essentially log. It is log in the center, and that definitely includes 2 stops above and below the actual center, but it has a very particular rolloff in the highlights and in the shadows. That is, it has a very strong S curve.
Random graph from a quick google search:
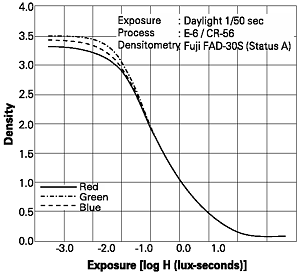
The center part of the chart range is the linear range, the curves at the ends are the log compression response. An S curve essentially describes a logarithmic progression. Response is is increasingly non-linear as you move away from center.
 Its curve is predominantly flat over log exposure. Over- and underexposure, development, printing lights, print stock gamma are all tools for manipulating the combined transfer curve of the process. Placing mid gray above or below the metered exposure (sometimes up to 2 stops or more) is not uncommon.