Bolex D16: RAW, 16/Super 16 sensor size, costs less than MkIII

^ I don't agree that film is essentially log. It is log in the center, and that definitely includes 2 stops above and below the actual center, but it has a very particular rolloff in the highlights and in the shadows. That is, it has a very strong S curve.
Random graph from a quick google search:
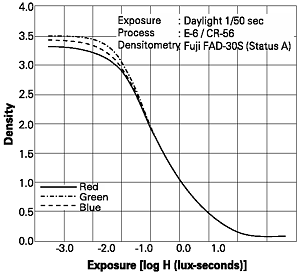
Astia_curves.png

The center part of the chart range is the linear range, the curves at the ends are the log compression response. An S curve essentially describes a logarithmic progression. Response is is increasingly non-linear as you move away from center.
 
From what I've seen mid gray is rarely in the center of the DR. Not enough tonal resolution in blacks to meter for the center of the DR and retain reasonable darks. Most display ready curves (jpeg, consumer video; any typical power gamma) will place mid gray some 3-4 stops below white clip, and compress 5 or more stops in the shadows.


Film is essentially log. :) Its curve is predominantly flat over log exposure. Over- and underexposure, development, printing lights, print stock gamma are all tools for manipulating the combined transfer curve of the process. Placing mid gray above or below the metered exposure (sometimes up to 2 stops or more) is not uncommon.

Most video cameras I have used since the 1980's apply some form of logarithmic compression to both highlights and shadows, commonly called knee (highlight) and toe (shadow) compression back then, but essentially the same thing. The only thing that differs is the the log multiplier at each end of the scale and how severe the compression is at the ends. It is true that the typical automatic exposure reference for video cameras is 3 stops below 90 IRE, or at 60 IRE for 18% gray. But the standard mid gray ISO light meter reference for Zone 5 is 12% reflectance, not 18%.
The modern log curves like S-log generate a much higher degree of compression overall at both ends and most seem to prefer middle gray reference at around 40 IRE. I have not seen a chart of S-log, but since they are emulating film negative response curves I would guess they use a curve shape more like the negative stock chart shown above and compress the shadows more to get nice highlight rolloff. But you can't really recover much useful shadow detail below 10 IRE, so the blacks just get crushed when you bring up the contrast or you wind up with a kind of milky gray look in the deep shadows without enough MTF to see any detail.

I routinely manually expose my GL2 1 to 1-1/2 stops under at 0 gain by the camera's internal meter and this corresponds to about a 100 ISO rating on my Sekonic L398. For the rare occasion I use auto exposure the -1 stop offset is locked in. There is some degree of compression going on in camera as I can recover highlight detail in some cases even when the 100% zebra shows clipping.
 
Last edited:
Most cameras you have used apply log first (or gamma, which is somewhat similar), then, on top of that, additional compression to both highlights and shadows, commonly called knee and toe.
Same for film, those midtones are not linear, they are log (look at the label of the horizontal axis).
Basically, most people (including me) have never seen a linear image because it's mostly useless. Everything is first compressed by log or gamma.
If you don't apply log first (that is, if you stay linear), the value that lies in the middle of your scale is an extreme highlight (just one stop below the white clipping point). You said it yourself: zone 5 is 12% reflectance, not 50%! That means it's a log scale.
And this is the curve for S-Log: it is log, but it doesn't have a knee (it does have a toe, because that makes the linear-to-log conversion more efficient, otherwise you're throwing away part of your gradation)
abelcine_slog.jpg


even-more-off-topic: how's that sekonic? I'm looking for a cheap light meter... Does that one work well in low light? (say, if you have to shoot at ISO 3200).

The old L398 is useless above about 800 ISO. Not sensitive enough. But I have seldom shot either film or digital camera at effective speeds above about 800 anyway. A true 400 ISO medium can see in the dark better than I can.

You are right about log gamma curves being applied to both film and digital imaging. Human senses all respond logarithmically, so it is necessary to accurately match the visual experience.
Your scope example does illustrate the point about log compression limitations though. You are not going to recover any useful shadow detail below about -4 stops in the curve you posted.

IMO the importance of learning to use Zone photography as a basic skill cannot be overstated if one wants to exercise predictable creative control over exposure and grading.
 
Last edited:
But the standard mid gray ISO light meter reference for Zone 5 is 12% reflectance, not 18%.

As far as I know, there is no ISO reference for this. There is an ISO recommended range for calibration constants which is pretty wide, and for the typical constants in use this results in approximately 15% to 18% reflectance. You will get 12% in the lower end only with hemispherical receptors, and they are not really useful for reflected readings. Meters are not created equal.

One notable difference between film DR graphs and digital DR graphs (as produced by a waveform monitor) is that film characteristic (sensitometric) graphs are log-log graphs (log exposure vs density), while digital camera DR graphs are typically log-linear (log-exposure vs signal output). The eye might see log but it needs linear light for this to happen. It is because of the gamma transfer applied to the linear sensor data that even standard gammas (like rec 709, or any typical power gamma, i.e. 2.2-2.6) have a (near) linear part in the mids of their graph. This is also the cause of the shadow compression (but not for highlights compression/knee, which violates the upper part of the power gamma distribution for the sake of soft clipping).

There are two different things going on here. The first is the applied display standard gamma compression which reproduces a linear gray scale range of the input signal in a smaller DR space. Each 10 IRE step represents a full 20log photometric stop, I.E. a 6dB change in value,divided by the gamma multiplier to fit within the smaller photometric range of the display standard. If you input a SMPTE color bar signal with chroma turned off you will see equal linear step values for each bar in 10 IRE increments from 0-100 IRE with no curve.
Curves show a separate logarithmic compression scale applied on top of the display standard gamma. These curves can take pretty much any shape the camera engineers deem appropriate to achieve a desired result. These days most cameras provide the user a range of predefined compression curves for different aesthetic results.
The scope display above shows a curve that maintains full photometric resolution for each stop above middle gray at 40 IRE with progressively less resolution for each stop below middle gray. The classic knee and toe "video look" compression curves tended to maintain full photometric resolution between 20 and 80 IRE with progressive compression below and above those points.

However with raw sensor data transforms, it is the user who has total control over the curve shape and degree of compression applied. You get to choose the precise cutoff point for black and white clip in the output signal as long as the raw data is within the linear capture range of the camera sensor. You get to define the trade offs between highlight retention and shadow detail and how much gamma compression or log compression is applied to achieve a look. Depending on the sophistication of the raw image processor, there is an infinite range of possibilities from stark black and white two tone with no grayscale to HDR tone mapping.
I am currently playing with Raw Therapee, a complex but very powerful open source raw image processor for Windows PC's. There are some 27 available menu tools in the exposure and gray scale menu alone. This is one of the reasons I really love the growing camera market for the open cinema DNG raw format as it does not restrict one's choice of tools to work with and the range of possibilities in creative image manipulation are mind boggling.
 
Last edited:
Back
Top