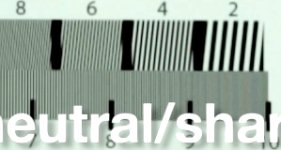
Canon 5d mark iii improved- olpf removed for higher resolution

Bill's second chart was lined up OK.

Jason Greene's post sharpened chart test:
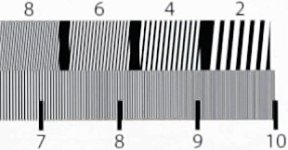
JG_CHART.jpg

Bill DePalma's MaxMax no-OLPF chart test:
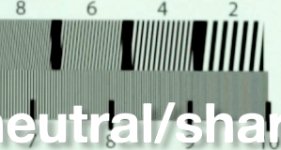
BD_CHART.jpg

Looking at Bill's real-world test videos, it did look a bit sharper. Post sharpening and no-OLPF are pretty similar, however max resolution is not increased. After 900 lines no-OLPF in this particular case looks a bit softer.
 
That's a pretty good tell. Are there no other variables to rule out? Difference in glass and f-stop, camera settings, so on and so forth?

I'm just looking for some info, not denying what I'm seeing because the first chart looks much better. Just wondering.

Once the camera gets back from the first gig I'm going to run it into the ground in my own way, particularly trying out some C/Y Zeiss and Nikon glass. Perhaps hyper sharp primes can bring out the detail without resulting to the sharpening? I can't stand that look, personally.

But, clearly, I am genuinely interested in using this darned thing. Mainly for car shots (interior and exterior).
 
I mean no offense here, but my eyes believe Bill may only be outputting one field from the NLE much as James did at first with his beach vid (before re outputting again). I didn't mention until now, but with the side by side, I think it's worth suggesting. That's what the A/B above looks like from here.

EDIT - Bill, is the chart from you straight from the cam or from an NLE?
 
Bill's second chart was lined up OK.

Jason Greene's post sharpened chart test:
View attachment 52623

Bill DePalma's MaxMax no-OLPF chart test:
View attachment 52624

Looking at Bill's real-world test videos, it did look a bit sharper. Post sharpening and no-OLPF are pretty similar, however max resolution is not increased. After 900 lines no-OLPF in this particular case looks a bit softer.

Interesting...

Pappas
http://PAPPASARTS.WORDPRESS.COM
http://TWITTER.COM/PAPPASARTS

[size=+1]BlackMagic Digital Camera Info:[/size] http://www.bmcuser.com/showthread.p...mera-Technology-Announcements-amp-Latest-Info
 
That's a pretty good tell. Are there no other variables to rule out? Difference in glass and f-stop, camera settings, so on and so forth?

I'm just looking for some info, not denying what I'm seeing because the first chart looks much better. Just wondering.

Once the camera gets back from the first gig I'm going to run it into the ground in my own way, particularly trying out some C/Y Zeiss and Nikon glass. Perhaps hyper sharp primes can bring out the detail without resulting to the sharpening? I can't stand that look, personally.

But, clearly, I am genuinely interested in using this darned thing. Mainly for car shots (interior and exterior).

My Pentax k 50mm f/1.2 is damn sharp and so are my Leicas and I've been adding about 20% sharpening in FCP7 to wide high ISO shots. Very happy with the look. Haven't had much time to shoot for the past week, busy doing pre-production chores, lawyers, costume design, casting etc....sigh. I've been mostly testing its limits rather than making it look its best.
 
Here's a better comparison- Jason's non-sharpened compared to non-sharpened no-OLPF:

Jason's stock:
JG_NO_SHARP_CHART_TEST.jpg

Bill's no-OLPF:
BD_CHART.jpg

(Use CONTROL-+ (control key and the plus key) to zoom the browser page to see better (and CONTROL-0 to turn off zoom)).

Thus, from these two chart tests it appears that out of camera, no-OLPF is indeed slightly sharper before 900 lines (provided Bill didn't sharpen in post). However, after post sharpening, stock might look sharper. Sharpening no-OLPF didn't appear to provide any more detail than stock post-sharpened.
 
Last edited:
Here's a better comparison- Jason's non-sharpened compared to non-sharpened no-OLPF:

Jason's stock:
View attachment 52635

Bill's no-OLPF:
View attachment 52636

(Use CONTROL-+ (control key and the plus key) to zoom the browser page to see better (and CONTROL-0 to turn off zoom)).

Thus, from these two chart tests it appears that out of camera, no-OLPF is indeed slightly sharper before 900 lines (provided Bill didn't sharpen in post). However, after post sharpening, stock might look sharper. Sharpening no-OLPF didn't appear to provide any more detail than stock post-sharpened.

Oh dear. There will be blood....
 
After 900 lines no-OLPF in this particular case looks a bit softer.
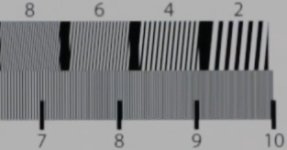
After 900 lines? Those charts are showing noticeable aliasing in 600 lines. Look at the top row, the diagonal lines. And remember, each quadrant is supposed to look like continuous parallel lines. Look at the "2" -- they're all supposed to look like that, that's what the original chart looks like. Then look at the 8, you don't see parallel lines at all, in the Jason Greene version it looks almost like a crosshatch. That means that the camera is clearly not resolving 800 lines at all. The 6 looks like parallel lines mostly, but with lots of cross-parallel aliasing in it.

If you look at Bill's 8, it is so aliased that it looks like the lines are actually going the wrong direction. That's completely inaccurate representation of what the chart is supposed to look like, which is pretty much the very definition of aliasing -- it's almost entirely composed of fake detail.

Forget the bottom row, that bottom row is nearly completely aliased out. The row up to 600 looks pretty good (the leftmost) but the block between 7 and 8 is heavily aliased in both, and the 8 to 9 is totally inaccurate, and the 9 to 10 is a complete smear. Remember, what you're looking for is absolutely uniform alternating black and white lines. If you see anything other than a perfect pattern of black and white lines, then it's rendering the chart wrong.

Based on both of those charts I'd say the resolvable detail is between 600 to 700 lines, and that the no-OLPF doesn't show any gain in actual resolved sharpness but instead shows a gain in aliased false detail (which is, of course, exactly what you would expect to happen when removing a low-pass filter that's designed to minimize aliasing; pull it out and you'll get more aliasing).

Looking at Bill's real-world test videos, it did look a bit sharper
As I wrote in my article on aliasing, aliasing can increase the perception that something is actually "sharper" than it really is, through the appearance of false detail. And the charts show a great example of that -- if you look at the diagonal "8" blocks, someone who didn't know what they were looking at might be tempted to think that Bill's camera is resolving more actual detail because you can clearly see diagonal lines in the "8" block whereas in Jason's, you can't discern any real pattern of diagonals. But that would be a faulty conclusion, because -- on the chart, those lines don't look like that! It's totally "fake" detail. Nothing about that chart shows diagonal lines that start at the upper left and move to the lower right, that's all fake.

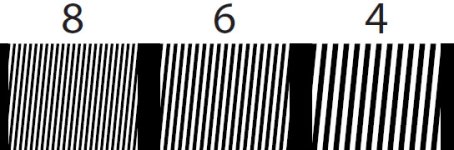
Here's a pictorial example. THIS is what the actual chart looks like:
extract.jpg


As you can see, block "8" is perfectly spaced, parallel lines. If the camera was actually able to resolve 800 lines, it would show that block looking exactly like it does in the picture above. But instead, with the maxmax removal, we got this:
attachment.php


You can plainly see that they don't look the same. Where did those wrong-direction diagonals come from? They are aliasing. They're fake. You can't look at that as "sharpness" because it isn't. It's an inaccurate representation of the image.

Now, compare that to Jason's:
attachment.php

Not that much better, right? I mean, it is also clearly not resolving the block of lines like they're supposed to look. BUT, at least it hasn't created a new fake pattern that makes you think you're seeing something that wasn't actually there! That's the difference. It's more of a blob of unresolved detail, rather than a blob of unresolved detail with a fake pattern over it. That's what the aliasing did -- it didn't actually add any real sharpness, it just created a fake pattern on top of a blob of unresolved detail. And that's why aliasing is so bad and why we harp on aliasing so much. It's deceptive, and it's fake.

If you like the look, and you think it enhances the image, hey, by all means, do what you like. But that's why we wanted to see actual charts, because it will reveal what's really happening in the image.
 
EDIT: this is all dependent on the original frames being shot properly and output properly. There was some mention of sharpening, and of outputting one field and whatnot -- if any of that type of thing happened, that of course throws the test results out. My comments above are based on the notion that the frames were shot and output properly and are an accurate representation of what the cameras actually do.
 
actually even in the old tests JCS keeps sayng "its 900 lines!!"

even Uwe and others have said it was 700-750 tops.

IMO. both looks the same. with or without OLPF. only difference is the high frequencies are softened down.
now back to reality,
ive shot with the mk3 and the af100 together. I couldnt tell the difference once edited.
you could pick out the extreme DOF as the mk3's obviously, but other than that, you cant tell them apart.

bottomline, the mk3 as is already looks good, theres no point in trying to prove its something it really isnt.
 
actually even in the old tests JCS keeps sayng "its 900 lines!!"

even Uwe and others have said it was 700-750 tops.

Yup, I kept reading it at 600ish as well, but conceded around 750 max. I'm still unsure how this 900 lines reading is from with or without OLPF - it's very aliased maybe jcs meant total extinction smear?

Well this resolution chart without the OLPF is interesting. I hope someone can do a side-by-side bind real world test with a camera. That'd be interesting :D

Definitely want to still see a side by side because at least then, lens, light, etc are all the same and are not variables like they are now.
 
Never understood where the crazy 900 line measurement was coming from. After the first videos I pegged it at 600ish, then talking with another user after an earlier chart 680. Bill's chart, which I guess I already pointed out a few posts back, definitely didn't look better than that. Worse. =T

Weird thing is that I actually do think the slightly aliased footage looks better, but at least we're closer to discovering that it's just aliasing.
 
Jason Greene & I originally stated around 900 lines (I stated 890, then revised to 850 after seeing more tests). In any case, I provide actual chart tests results so that anyone can form their own opinion. Jabs and personal attacks are a waste of energy, and perhaps the poster(s) might reflect on the state of their ego (which ultimately causes great pain for themselves as well as others). Recall when I first proposed post-sharpening (and provided examples showing it worked), there was skepticism and now it is accepted (once Philip Bloom tried it). Again, in my day job I write image processing software and work with CPU & GPU algorithms (including real-time DCT and spectral analysis methods). I do my best to describe the math in a manner that understandable to all. The "I" in this paragraph is indeed part of the ego, however it's trying to be helpful.

Aliasing is related to the Nyquist sampling frequency, and thus the max theoretical horizontal resolution we can store with 1920 pixels is 1920/2 = 960. However, all camera manufacturers who create pro cameras state 1000+ lines. Therefore, even though "first (aliasing) artifacts" occur at much lower resolution (even before 960), there is useful information, even if it is aliased, all the way up to extinction. Therefore, I state useful resolution at the point of extinction, when aliasing smears the image to the point of noise (no useful information). This is the clearest way to agree on the limit of actual, useful information and resolution (the point of first artifacts is harder to agree on, and doesn't make sense to use as we have useful information all the way up to extinction).

Bill took a risk and had his camera modified by MaxMax. He posted the results and many of us thanked him for doing so. Unfortunately, the results didn't work out as planned, and some folks were extremely unkind. For those with critical comments, put yourself in Bill's shoes: he took a risk, spent time & money, and shared the results with the community. There is no advantage to the community to be harsh in this case. If one finds oneself being harsh when someone is trying to be helpful, ask yourself why, and perhaps read this book: http://www.amazon.com/New-Earth-Awa...9963/ref=sr_1_1?ie=UTF8&qid=1335469053&sr=8-1, or if you are up to something significantly more challenging: http://www.amazon.com/Zen-Buddhism-...=sr_1_1?s=books&ie=UTF8&qid=1335469143&sr=1-1. We all have the same goal- we'd like to produce the highest quality material for our projects at a reasonable cost.
 
there's cross hatching aliasing on the EX1 at 6/700 lines also. As can be seen here:
Does this also mean the EX1 only resolves 600 ish lines>?

Any answers? Is the EX1 also only 700 lines?? Who decides at what point that crosshatch takes away the lines?

That video is GREAT because it really shows some ugly truths. That the codec on the 5D Mark III is better than XDCAM. The mosquito noise difference is unbelievable as are all the mpeg2-blockings. Sharpening completely destroys the EX1. That h264 codec has always been pretty good but alot of people have attributed aliasing etc to be the result of the codec. It's not.

I bet that once the 5d mark III becomes more popular, people will do seriously good work with it.
 
Last edited:
Back
Top