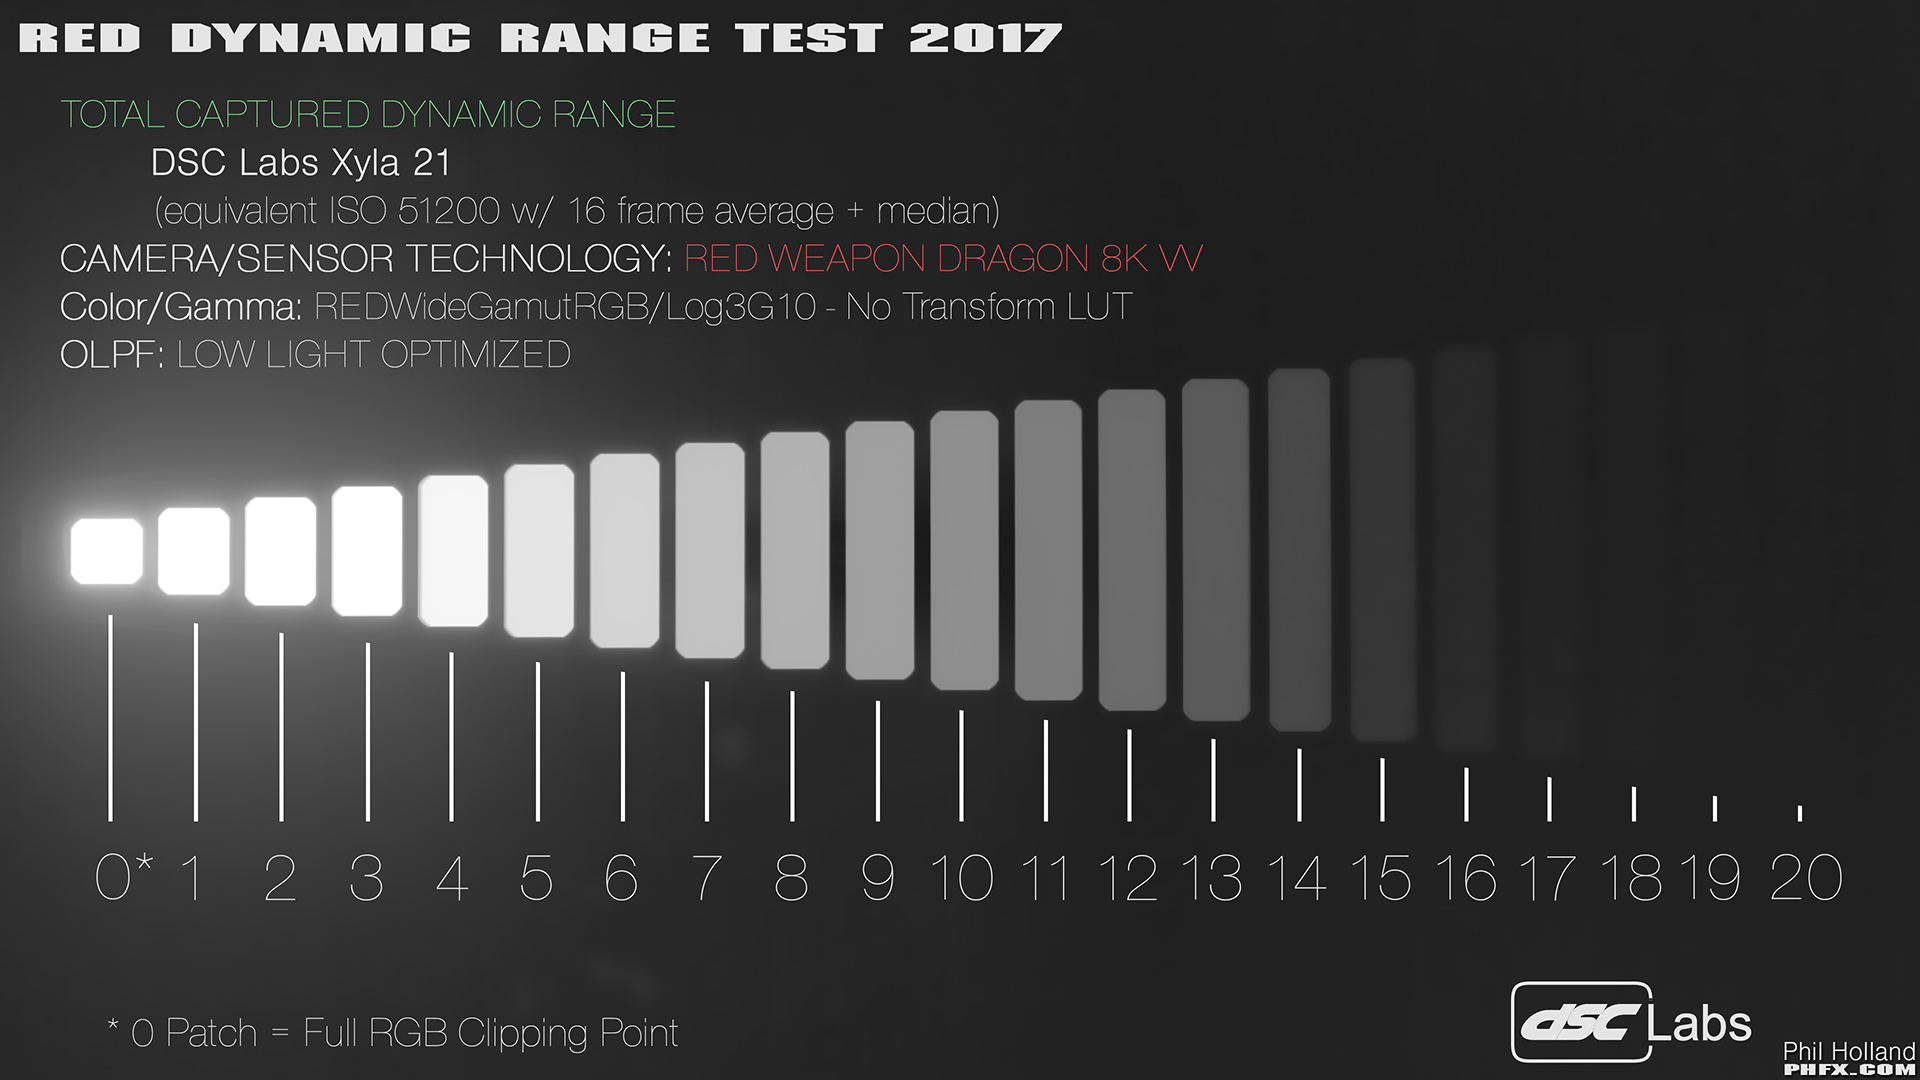
RED unveils Monstro 8K VV full-frame sensor with 17+ stops of dynamic range

INzqizS.jpg


Brought that test chart into Davinci to get a better sense of what we're seeing, the waveform shows 13 (and a bit) distinct stops. The rest of it is either clipped out or down in the noise floor. That would seem to hold true to my real life experience of shooting with Dragon - plenty of DR for just about any application, not as much as the Alexa, but still very good.

If Monstro adds 2/3s of a stop, that'll bring it to a genuine 14 stops, and that's terrific.

I count 17.

The fact that the highlights are clipped on a photography of the test chart does not mean what you think it means, all it means is that the camera used to take that picture does certainly not have a 17 stop dynamic range.
 
Last edited:
I count 17.

The fact that the highlights are clipped on a photography of the test chart does not mean what you think it means, all it means is that the camera used to take that picture does certainly not have a 17 stop dynamic range.

The camera used for the photography of the test chart is the Red Weapon (Dragon). It's a frame of footage from the camera.
 
I've isolated just the chart elements to make it clearer. The histogram perhaps shows it best:

VIbhep4.jpg


Those top 'three' stops, are clearly not distinct stops (you can see that they register as a singular brightness value on the histogram). You can count thirteen distinct stops and part of a fourteenth that proceeds to merge into the noise floor.
 
It is tricky because the way those stops were measured is a backlit chart, so there is also blooming/veiling from light shooting down the barrel of the lens, which creates some light contamination across the different steps...specially in the brightest steps. So in a way, even the original chart (not to mention a compressed jpg) does not produce perfect results. Still, I know that there were NDs used to create those distinct steps in that chart, so I'm confident those top three steps indeed are distinct steps in the original chart. The only thing the blooming/veiling affects is that it won't render a precise mapping of the curve...and may slightly boost the blacks. But no big deal.

I wouldn't get too up in arms about Red's DR claims. After all, everyone will rate the cameras differently based on their own methodologies and taste once they are out in the field. I'm sure it'll be a fine camera, specially for those whom already enjoy working with Reds. I'm even willing to bet they will even sell quite a bit of them...even with the high price tag. But, that remains to be seen.

Personally, I might be more inclined to buy 2 used Alexa minis before buying a new Monstro, but that is of no consequence because I can't afford this hypothetical...haha. Plus, I haven't even seen any images from the camera yet. But yeah, I'm curious.
 
Yes, come on, DVXUser, zoom out! Zoom out!

I posted about how I wish camera makers would pick a standard and stick with it, because it would make it easier on us consumers. (I posted it not thinking that it would happen just because I said so. But hey, I cast my little vote, just like in the presidential election.)

Since then the pot has churned. But in all honesty I am good with about 12 honest stops (or even less) based on the images I've seen from Canon RAW (11.7 stops) and real-world light measurements (11 stops even in extreme situations). I guess it would be okay, as long as I am not stuck with the engineers' grade, in 8-bit 4:2:0. Preferably it's raw or 10-bit Prores --- which, come to think of it, is more and more the case these days!
 
Were is the raw frame?
All you show is a crummy 8 bit jpeg image with blown out highlights.

You can't draw any conclusions about the dynamic range from that image.

No raw frame has been provided, it doesn't matter though, because all we're measuring is a fixed frame of a dynamic range chart, and even a crummy 8-bit JPEG is perfectly capable of showing us 21 steps of brightness from white to black. An uncompressed 16-bit TIFF file of the same frame wouldn't measure any differently on a waveform.

The original frame is DRAGONcolor2/REDlogFilm, so the gamma curve isn't really giving us a linear representation of how those various stops relate to each other. So if we use ACES to apply a DRAGONcolor2/REDlogFilm IDT and a Rec709 ODT, we then get a proper linear distribution of brightness as determined by the folks at Red:

xLCXa8r.jpg


Now if we take that linearised distribution and then raise the exposure of the frame until the stop below those first three chart is at the same level as they were initially, we can see the actual pattern of distribution required to register distinct stops of brightness at the top end of the image:

vucJMFH.jpg


You can see that the top four stops of the image are still squished into the very top end of the image (from 896 IRE to 1023 IRE), but there are distinct gradients between them.
 
No raw frame has been provided
That is the problem, you can convert the raw image to a Rec 601/709 jpeg a million different ways.

because all we're measuring is a fixed frame of a dynamic range chart,...
No, you are measuring a jpeg that was graded and is obviously blown out.

even a crummy 8-bit JPEG is perfectly capable of showing us 21 steps of brightness from white to black.
If it is an image with a proper curve that does not blow the top three brightness bars out with some extreme highlight roll off then yes!

An uncompressed 16-bit TIFF file of the same frame wouldn't measure any differently on a waveform.
You are missing the point.

You keep doing a futile exercise with this jpeg image. :)
 
Last edited:
gotta say the most important thing i see with this camera is not the 8k or dynamic range, but how clean 6400 iso was. This is a7s territory we are talking about.
 
Grug is right that the image shows exactly as many stops of DR as he's counting. And Cary Knoop is right that if the image was badly processed before being posted online, then the camera may have more DR than the image shows.

In any case, it's just a test chart. I used to work with these a few years ago, when I was making Flaat. But then I switched to real-world tests, the kind where you have a scene and you under/over expose your image several stops until it breaks on both ends. A camera that showed over 11 stops of DR on a chart (here) then gave me just 6 stops on this real-world test here (where I set the "usable" bar very high, by demanding that fine textures be visible) and 10 on this other real world test (where I just demanded big areas to be visible). I find these test charts of very little use, lately. It's better than nothing, but a real-world test tuned to your needs (and those needs can vary from one project to the next) is a lot better.
 
Just to be clear:

Phil Holland always tests these cameras and here's one where a chart is showing the Weapon with 21 stops. The camera sees them as he mentioned, but they aren't all usable.

"Remember this is a stress test, but yes, Weapon can indeed "see" all 21 stops amazingly. Are those "Usable Stops"? No, not exactly, but it does tell a bit of the story."

And my opinion is that this applies to EVERY company.

The C300 Mark II, FS7, EVA1, C200, REDs, URSA Minis, etc. all can claim a certain number, but I personally might find it to be a bit lower, and there is nothing wrong with that nor does it affect a camera's standing or performance.

That's all...nothing else.

http://www.reduser.net/forum/showthread.php?137883-RED-Weapon-Dynamic-Range-and-Latitude-Examined

View attachment 127127

That image is use 16 frames to average across which will reduce noise and increase what you can see in the shadows quite a bit. Do 16 frame average with other cameras rated around 14 stops and you'll suddenly see the same if not more.
 
You can count thirteen distinct stops and part of a fourteenth that proceeds to merge into the noise floor.

I count thirteen stops all up. Count the intervals, not how many chips you see and discern. The difference between two chips is a stop and what you measure.

Also, sorry you have to deal with this guy I quote below who has no idea.

No, you are measuring a jpeg that was graded and is obviously blown out.

Poor Grug. This guy doesn't understand at all.
 
That is the problem, you can convert the raw image to a Rec 601/709 jpeg a million different ways.

No, you are measuring a jpeg that was graded and is obviously blown out.

You are missing the point.

You keep doing a futile exercise with this jpeg image. :)

Cary, Phil is a very smart guy, who does very technical work, for some of the biggest movie studios in the world, I hardly think the accurate processing of a jpeg is beyond his means.

Even if you use the 250 ISO sample he posted (which has far less glare, and contaminating artifacts) the result remains the same, the top three 'stops' read with essentially identical vales.

I understand that you believe that a small jpeg couldn't show the full dynamic range of the chart, but Phil's frames are 271kb, and this jpeg from the DSC website is just 27kb and has so much compression artifacting, that it had to be heavily blurred just to get a clean enough result to show accurate measurements (i.e. it's as crappy as a jpeg can get):

B9mwZmd.jpg


And yet each of the 21 stops is clearly delineated from the others. And when we bring it into Davinci, we see precisely the separation between stops that we would expect to see:

l6KaSZh.jpg


But our argument basically boils down to whether or not we trust Phil to deliver reliable, accurate information or not. Personally, I do.
 
Cary, Phil is a very smart guy, who does very technical work, for some of the biggest movie studios in the world, I hardly think the accurate processing of a jpeg is beyond his means.
To use this tool properly the camera must be exposed in such a way that only the bar on the extreme left is at clipping point in all channels.
The next bar is half the amount of light and the next one half of that and so on, so if more than one bar on the left is at clipping point something must have gone wrong. No camera is at clipping point at the extreme left and at one stop below at the same time, it would simply mean that you have to adjust the exposure one stop down to make sue that only the extreme left bar is at clipping point.

The result out of camera is obviously not a jpeg so a jpeg must have been produced from the test frame(s). Either this jpeg was produced with an extreme roll off at the highlights (possibly to leave more room for the midtones and shadows for illustrative purposes) which made the three top bars go to the clipping point or the exposure in camera was incorrect and exposed at clipping point at the third bar.

I understand that you believe that a small jpeg couldn't show the full dynamic range of the chart
I don't believe that at all, in fact I wrote a few postings ago about this possibility:

If it is an image with a proper curve that does not blow the top three brightness bars out with some extreme highlight roll off then yes!
 
Last edited:
LOL, a fight and complaining about sensors that shoot +13 stops of DR. WTH? Stay away from any reversal film, will ya? You will be disappointed and lost...Cameras now seem to be shipping all with 13-14+ DR standard (even down to consumer grade) and you all will still find something to complain about?
 
To use this tool properly the camera must be exposed in such a way that only the bar on the extreme left is at clipping point in all channels.
The next bar is half the amount of light and the next one half of that and so on, so if more than one bar on the left is at clipping point something must have gone wrong. No camera is at clipping point at the extreme left and at one stop below at the same time, it would simply mean that you have to adjust the exposure one stop down to make sue that only the extreme left bar is at clipping point.


Ah, that’s where the problem is.

Cary, you are describing what you would expect to see in linear light. But that is no the case here. These files are processed in RedLogFilm. Linear light would indeed reveal the true light carachterisitcs, like halving each stop—and you can set RedCineX to show that—but that’s not typically the way we look at images.

Also, in terms of methodology, it’s common to go past the first chip on the chart and then bring up the second to max. Why? If you only bring the exposure to max out the first stop, there’s the risk of you blowing past it by a half stop or more. You won’t see this, because it still just ‘maxed out’. But that would mean that the gap to the second stop might only be a half, or a quarter stop, but you’d think it’s a whole stop. Now, if you have ways to carefully control lighting and a good scope setup, I think you could go off of the first stop, but like I say: it’s common to go past it and start from the second.

From that point, what you’re seeing is highlight rolloff in RedLogFilm.

Regardless of all this, I don’t think there has ever been a single test showing a RED to have more DR than the Alexa. At the end of the day we get back to that “usable DR” definition. Geoff Boyle has done several in depth tests too of basically all cinema cameras, and he also doesn’t reach 16 stops. But let me say that I think Phil Holland is very serious and careful in his ways, so I’m not disputing his images. It’s more a situation where I think a single DR chart won’t tell the whole story.

Anyway: surely Monstro looks like a great sensor? I’m surprised by the amount of ridicule and backlash here. Yes, it’s not priced as the logical upgrade for a GH5 shooter, but so what. The Monstor 8k VV will be used in scenarios where its price is irrelevant and RED uses that simple fact to recoup some development costs.
 
Ah, that’s where the problem is.

Cary, you are describing what you would expect to see in linear light. But that is no the case here. These files are processed in RedLogFilm. Linear light would indeed reveal the true light carachterisitcs, like halving each stop—and you can set RedCineX to show that—but that’s not typically the way we look at images.
The problem?
Excuse me, but I did not say anything about on what curve this was recorded, I only talked about the light output levels of the tool.
Regardless of how the sensor output was recorded the top brightness bars should have distinguishable code values in the resulting camera output.

Also, in terms of methodology, it’s common to go past the first chip on the chart and then bring up the second to max. Why? If you only bring the exposure to max out the first stop, there’s the risk of you blowing past it by a half stop or more. You won’t see this, because it still just ‘maxed out’. But that would mean that the gap to the second stop might only be a half, or a quarter stop, but you’d think it’s a whole stop. Now, if you have ways to carefully control lighting and a good scope setup, I think you could go off of the first stop, but like I say: it’s common to go past it and start from the second.
Here is a link to an image on Phil's website, the four brightest bars are all RGB 255 and it states that the 0 patch is the full RGB clipping point!

phfx_2017_RED8KSensorTest_totalCapturedDynamicRangeDragon.jpg


Now does that mean that the four bars (or three) should be discounted because they are all RGB 255?
Of course not!

I suspect the jpeg is color corrected with a very steep highlight roll off to leave more room for the midtones and shadows (people tend to want to see the shadows to determine where that last recognizable stop is).

How could anyone seriously think that because some color corrected jpeg shows 4 RGB 255 bars they should not be counted in determining the dynamic range?

But that is exactly what is happening in this topic!

What is peculiar is that no-one else is prepared to point that out, instead folks seem to prefer to frame this as my problem in lacking understanding.
For what purpose?
 
Last edited:
Hmm. I wonder if there is a fair amount of cross talk going on here.

Excuse me, but I did not say anything about on what curve this was recorded, I only talked about the light output levels of the tool. Regardless of how the sensor output was recorded the top brightness bars should have distinguishable code values in the resulting camera output.

The way it was worded and some previous talk about the readout of the chips in the chart misled me into thinking the expectation was to see the actual chart behavior (one stop increments) reflected in the output image.


Here is a link to an image on Phil's website, the four brightest bars are all RGB 255 and it states that the 0 patch is the full RGB clipping point!

That’s great because it clearly states what methodology was used, so now we know that. Either I missed that information previously, or it was omitted. In that case we can just start counting from that point, since just like you say we know that each subsequent stop is half the amount of light and can’t possibly be clipping.

Now does that mean that the four bars (or three) should be discounted because they are all RGB 255? Of course not!

Of course not.
 
Back
Top